27 July 2010 – Chart of the Week
Chart of the Week: The ISM and the “V”
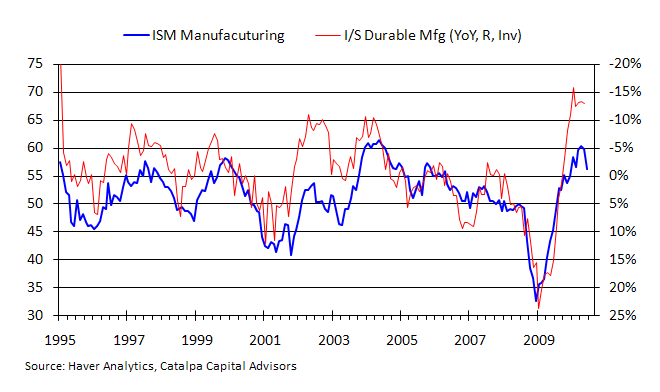
After a powerful “V” recovery, the Institute for Supply Management’s survey of US purchasing managers pulled back in the last few months. Some of the regional surveys suggest that there could be some further cooling still to come. However, it is probably premature to conclude that this particular leading indicator is rolling over. Even with the recent pullback, the ISM currently stands at 56.2, well above the breakeven level of 50.
The macro environment continues to be supportive. For instance, the ISM closely tracks the ratio of durable goods shipments and inventories. Purchasing managers typically become cautious when the ratio goes up (softer shipments and rising inventories) and turn positive when the ratio goes back down (shipments pick up and inventories dwindle).
Going into the recession, shipments plunged and inventories surged. The shipments-to-inventory ratio rose to 1.83 in January 2009, a full 23.8% higher than the year before and the biggest surge in nearly 30 years. Around the same time, the ISM manufacturing composite index duly collapsed to a thirty-year low of 32.5. Then, after manufacturing came to a shuddering halt, the ratio began to reverse.
Over the next twelve months inventories were rapidly worked off and shipments eventually began to firm, bringing the ratio down 15.9% by January 2010. Over that period, manufacturing turned around dramatically and the ISM survey roared back in a dramatic “V” recovery, leading the way for much of the macro data that has since followed.
Currently, the durable goods shipment-to-inventory ratio remains close to its recent lows. Farther along the production process, the ratio at the wholesale level for all manufactured goods (including durable and nondurable goods) is near multi-decade lows. For retail, the ratio is the lowest ever reported. Data like that points to a tightening supply chain and is characteristic of a business cycle that is still unfolding. Rather than rolling over, leading indicators like the ISM could be set for robust expansion for many quarters to come.
The information presented in this presentation (the “Presentation”) has been prepared solely for informational purposes and is not an offer to buy or sell or a solicitation of an offer to buy or sell Interests or any other security or instrument or to participate in any trading strategy. No representation or warranty (express or implied) is made or can be given with respect to the accuracy or completeness of the information in this Presentation. No person has been authorized to make any representations concerning the Interests described in this Presentation that are inconsistent with the statements contained in this Presentation.