12 October 2009 – Chart of the Week
Chart of the Week: The SEMI book-to-bill ratio
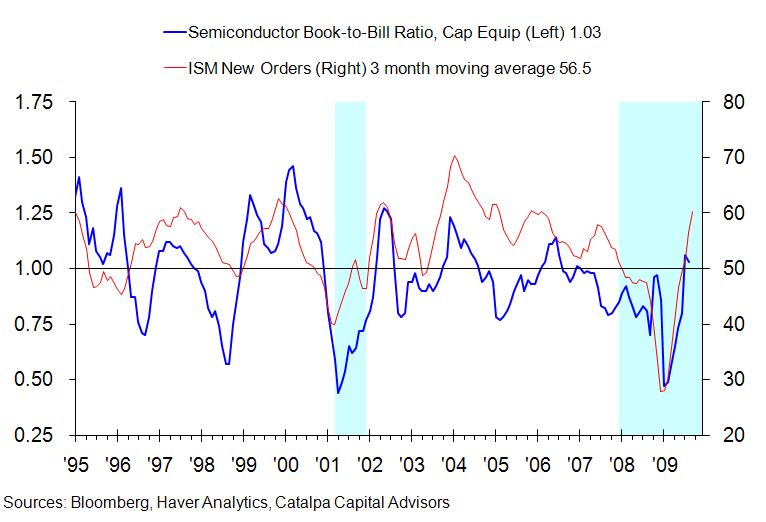
For most of the year, technology stocks have been leading global equities. Tech could retain that sector leadership for some time to come. Each month, Semiconductor Equipment and Materials International (or “SEMI”) releases a survey of North American semi companies. The key metric that they release is the book-to-bill ratio, a three-month moving average of new orders that have been booked divided by the dollar value of billings over the same period. A ratio above one indicates that the industry is expanding.
Going into the recession, new bookings had already been lagging for some time and plunged into a post-Lehman vortex at the end of last year. However, as the new year began, and roughly coincident with the improvement in the technology sector, bookings began to pick up and are now running ahead of billings in the latest data (the blue line in the chart). The ISM’s new orders index (the red line on the right-hand scale) reinforces that picture of renewed growth in the semi sector as the broader economic recovery gains momentum.
The information presented in this presentation (the “Presentation”) has been prepared solely for informational purposes and is not an offer to buy or sell or a solicitation of an offer to buy or sell Interests or any other security or instrument or to participate in any trading strategy. No representation or warranty (express or implied) is made or can be given with respect to the accuracy or completeness of the information in this Presentation. No person has been authorized to make any representations concerning the Interests described in this Presentation that are inconsistent with the statements contained in this Presentation.